With the new statistics visualization feature, you can quickly view the distribution of V, D, and J gene usage, as well as CDR3 (junction) length.
Note that this statistics feature is an extension to the AIRR Data Commons API, and not all repositories have implemented this extension and therefore will not be able to display repertoire statistics.
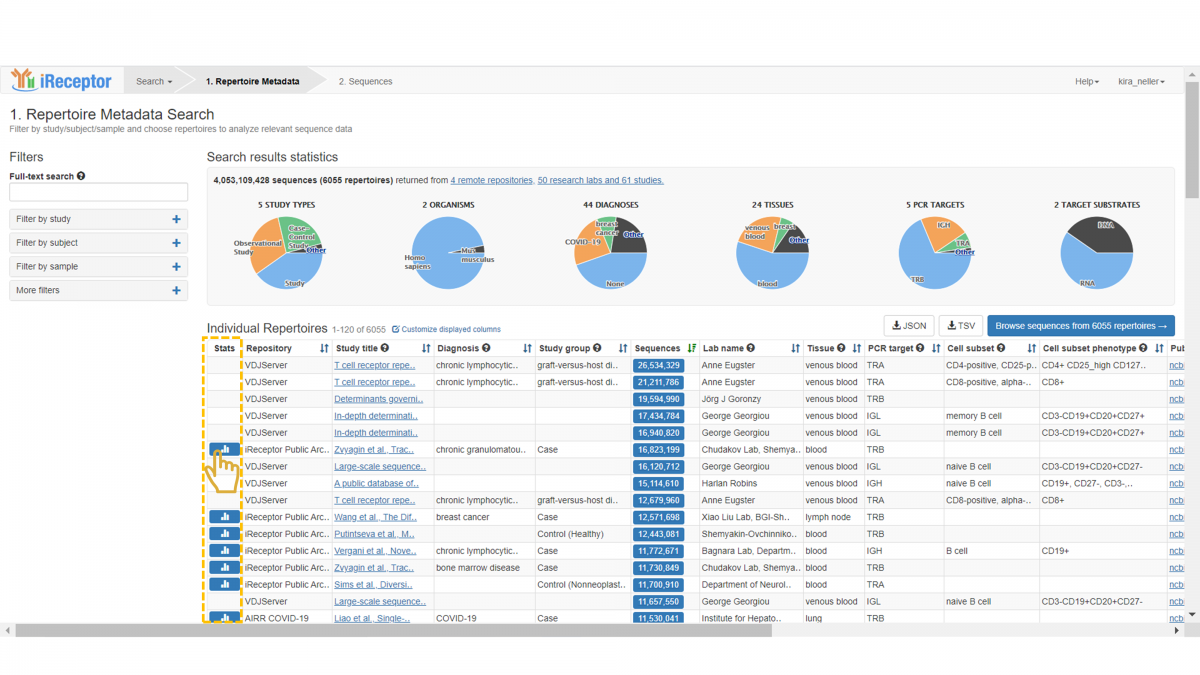
If statistics are available for a repertoire, you will see a corresponding button in the “Stats” column. Click on this button to open the statistics panel.
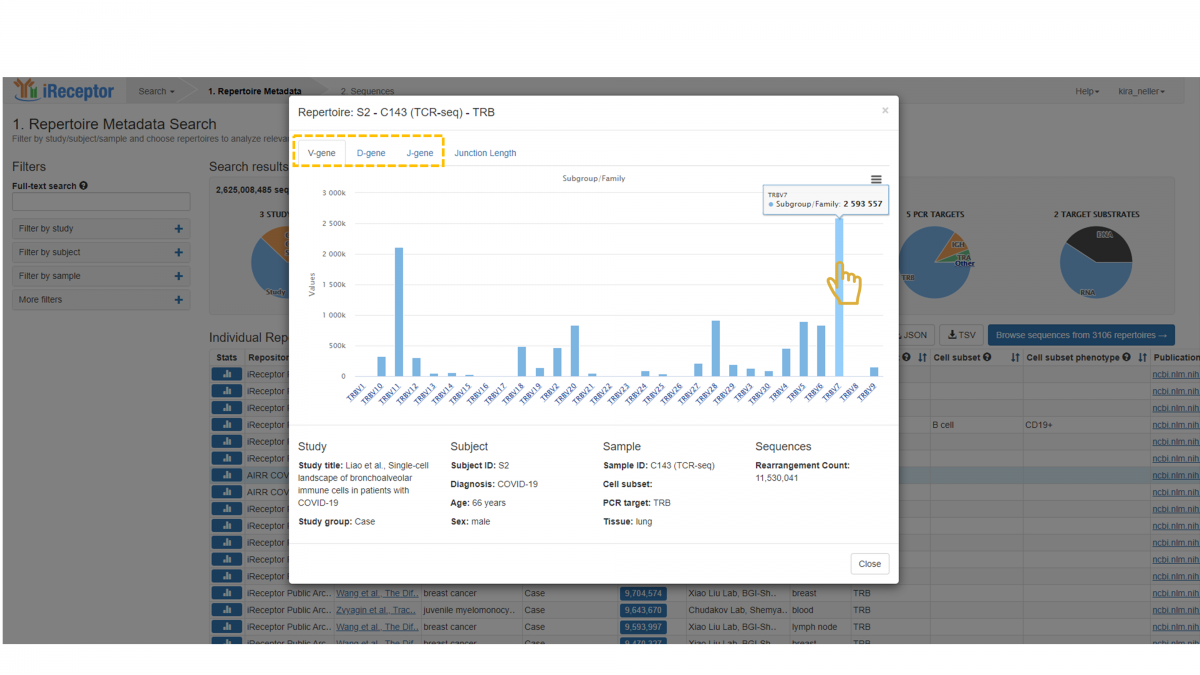
The statistics panel contains separate tabs for V-gene, D-gene, and J-gene distribution, each with an identical layout. The lower panel provides a summary of key metadata fields.
Here, we see the V-gene distribution for a repertoire of interest. There are three “levels” of gene classification available: Subgroup/Family, Gene, and Allele. This classification agrees with the IMGT gene nomenclature system. The default view opens to the subgroup/family level distribution. The x-axis indicates the set of V-gene families that were found in the repertoire, and hovering over an individual family displays the exact count.
Note that many annotation tools provide more than one gene call for a single sequence, as it is ambiguous as to which gene call is correct. In these cases, a single gene call (e.g. a V-gene call) might have more than one value (e.g. IGHV5-51*01 or IGHV5-51*03). In this case, the iReceptor statistics would add to the count for both IGHV5-51*01 and IGHV5-51*03. In this manner, it is possible for the sum of the counts in a repertoire gene graph to be higher than the total number of sequence annotations in the repertoire. If there are no ambiguous gene calls, then the sum of the counts would equal the number of sequence annotations (i.e. “rearrangement count”).
To view the next level down, i.e. gene level, click on a specific family – here, we choose TRBV7.
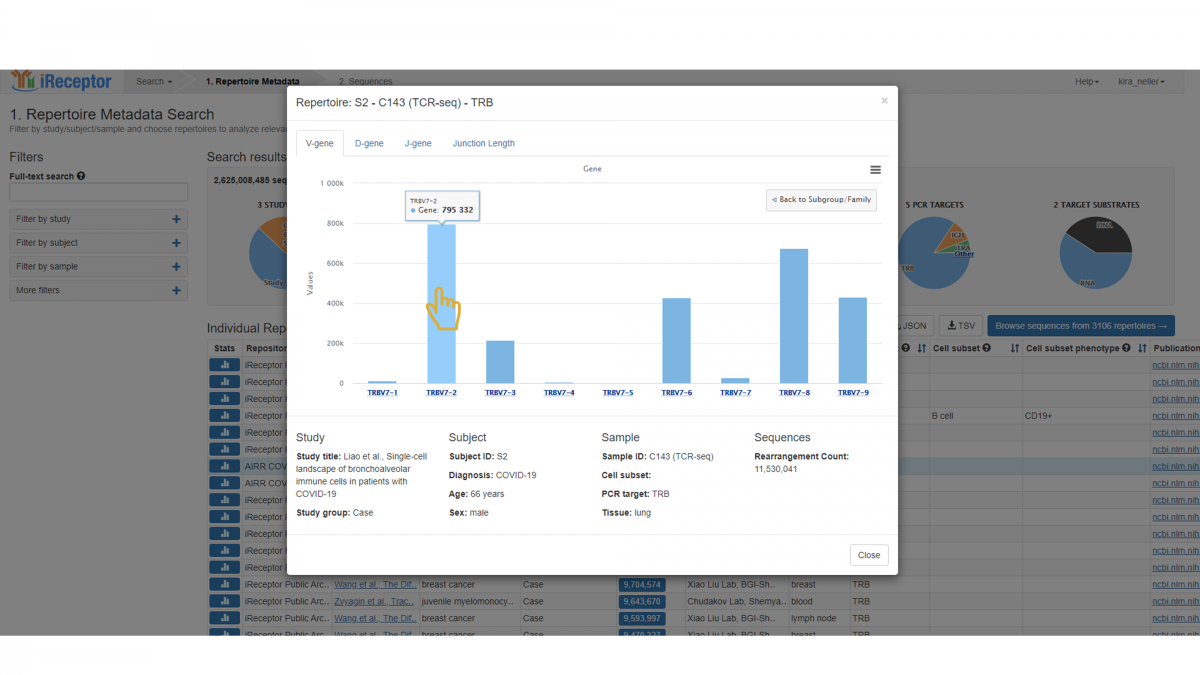
This reveals the distribution of family TRBV7. Specifically, the number of sequences annotated with each gene is indicated. Only those genes represented in the repertoire are included in the graph.
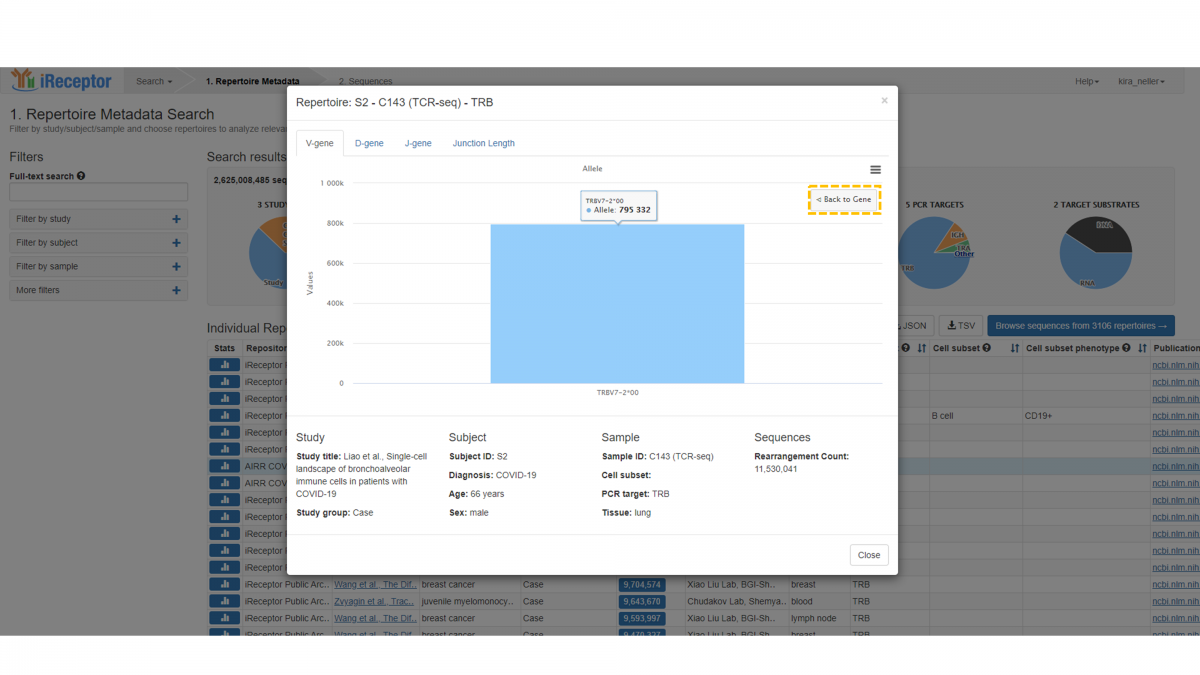
Clicking on a specific gene will bring you to the lowest level of distribution – allele level.
To return to the previous levels, click the “Back to Gene” button, then back once more to the highest level, i.e. Subgroup/Family.
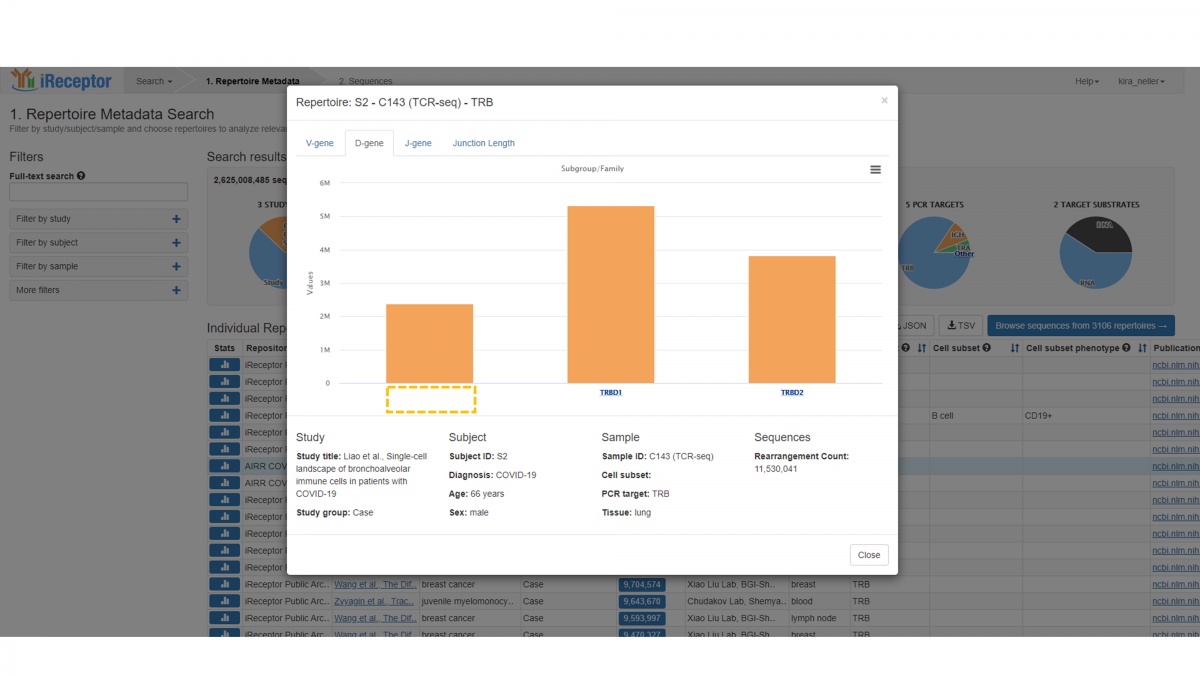
You can interact with the D-gene and J-gene distributions in an identical manner. Note that in this case there are a large number of sequence annotations that do not have a D-gene assigned, and therefore there is a significant count with no label in the graph.
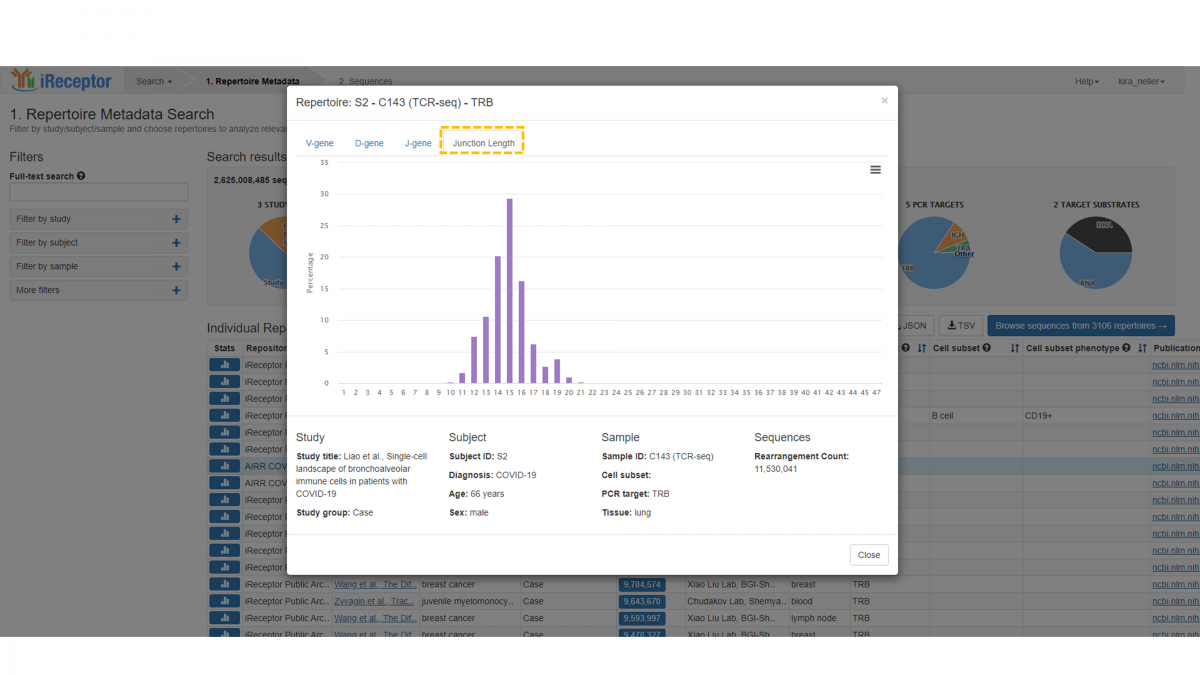
The final tab provides the length distribution (in amino acids) of the annotated junction region (which includes the CDR3 region plus the conserved leading and trailing amino acids), with counts indicated as a percentage.
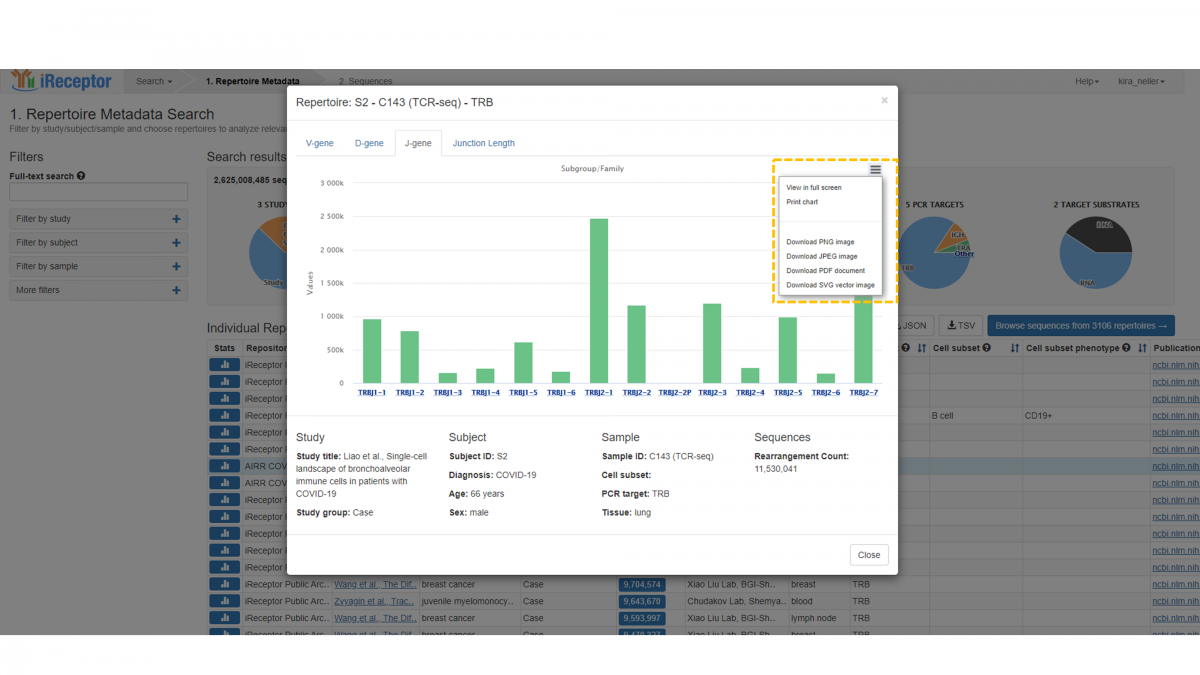
The statistics visualization feature aids repertoire browsing on the Gateway. To save the results of the visualization you may download an image for your reference.
- Log in to post comments
